The Webhook debugger tool provides an interface for you to see the webhooks triggered from the Optix platform. It displays the payload and delivery status for each webhook.
Webhooks Debugger Tool
On this page
Using the tool
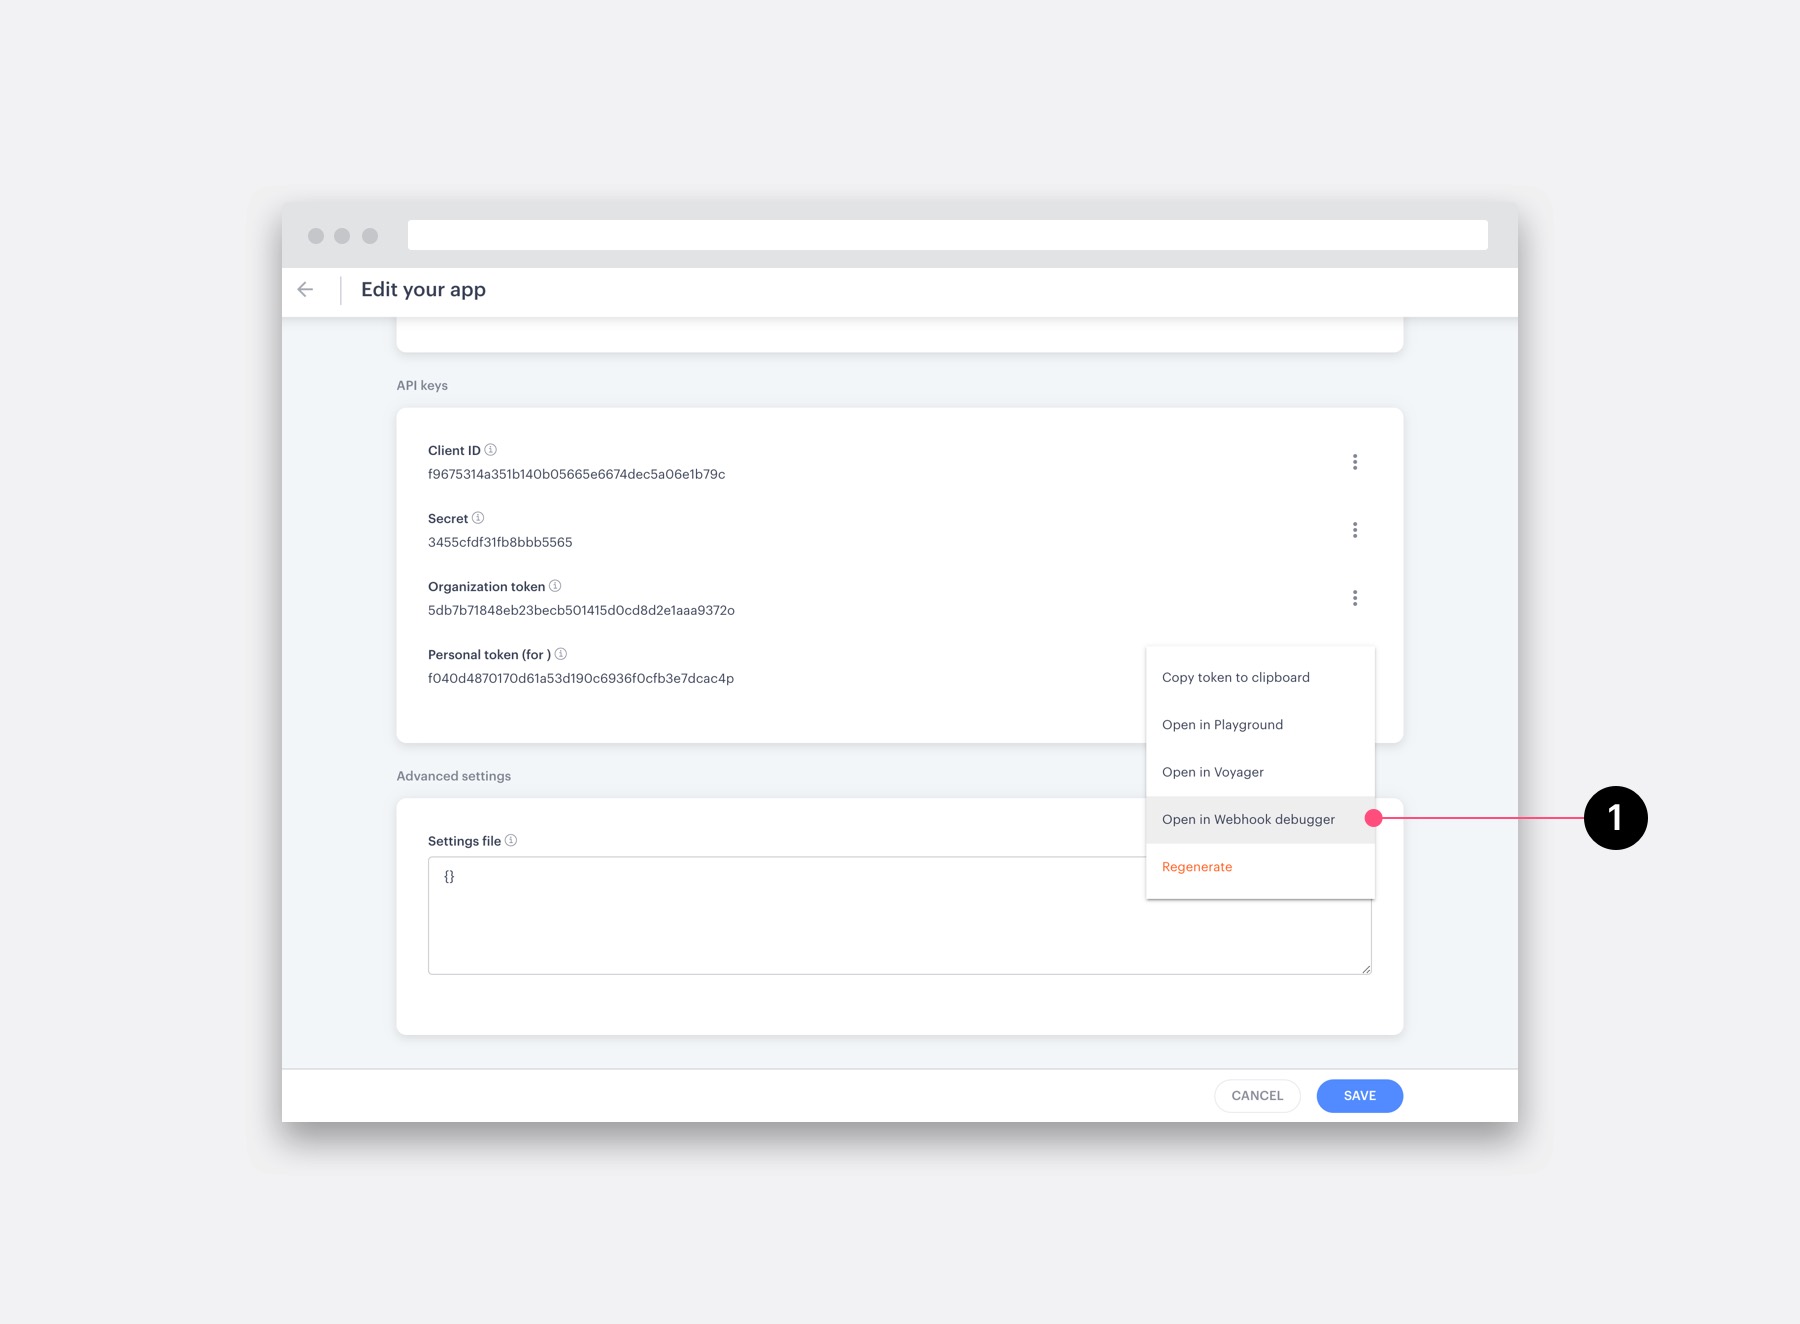
This tool only shows webhooks triggered at the Optix Organization where the app was created (in Apps → Develop). Webhooks triggered at other organizations are not visible for you. This tool is available on the ‘Develop’ page, under the personal token ⋮ menu.
Webhook debugger demo
This live demo shows what you can expect from the Webhook debugger:
Got questions?
We are here to help. Ask us a question and we’ll do our best to answer as soon as possible.
Previous
Webhooks ListNext
Using Canvases